Pendo Connector
This guide covers implementing the Pendo connector. Pendo is a product experience platform that helps teams understand user behavior through in-app analytics, guides, and feedback.
Descope can automatically collect authentication logs and audit events and stream them to your Pendo account as track events, so you can analyze admin and user activity alongside your other product analytics.
Configure Pendo connector
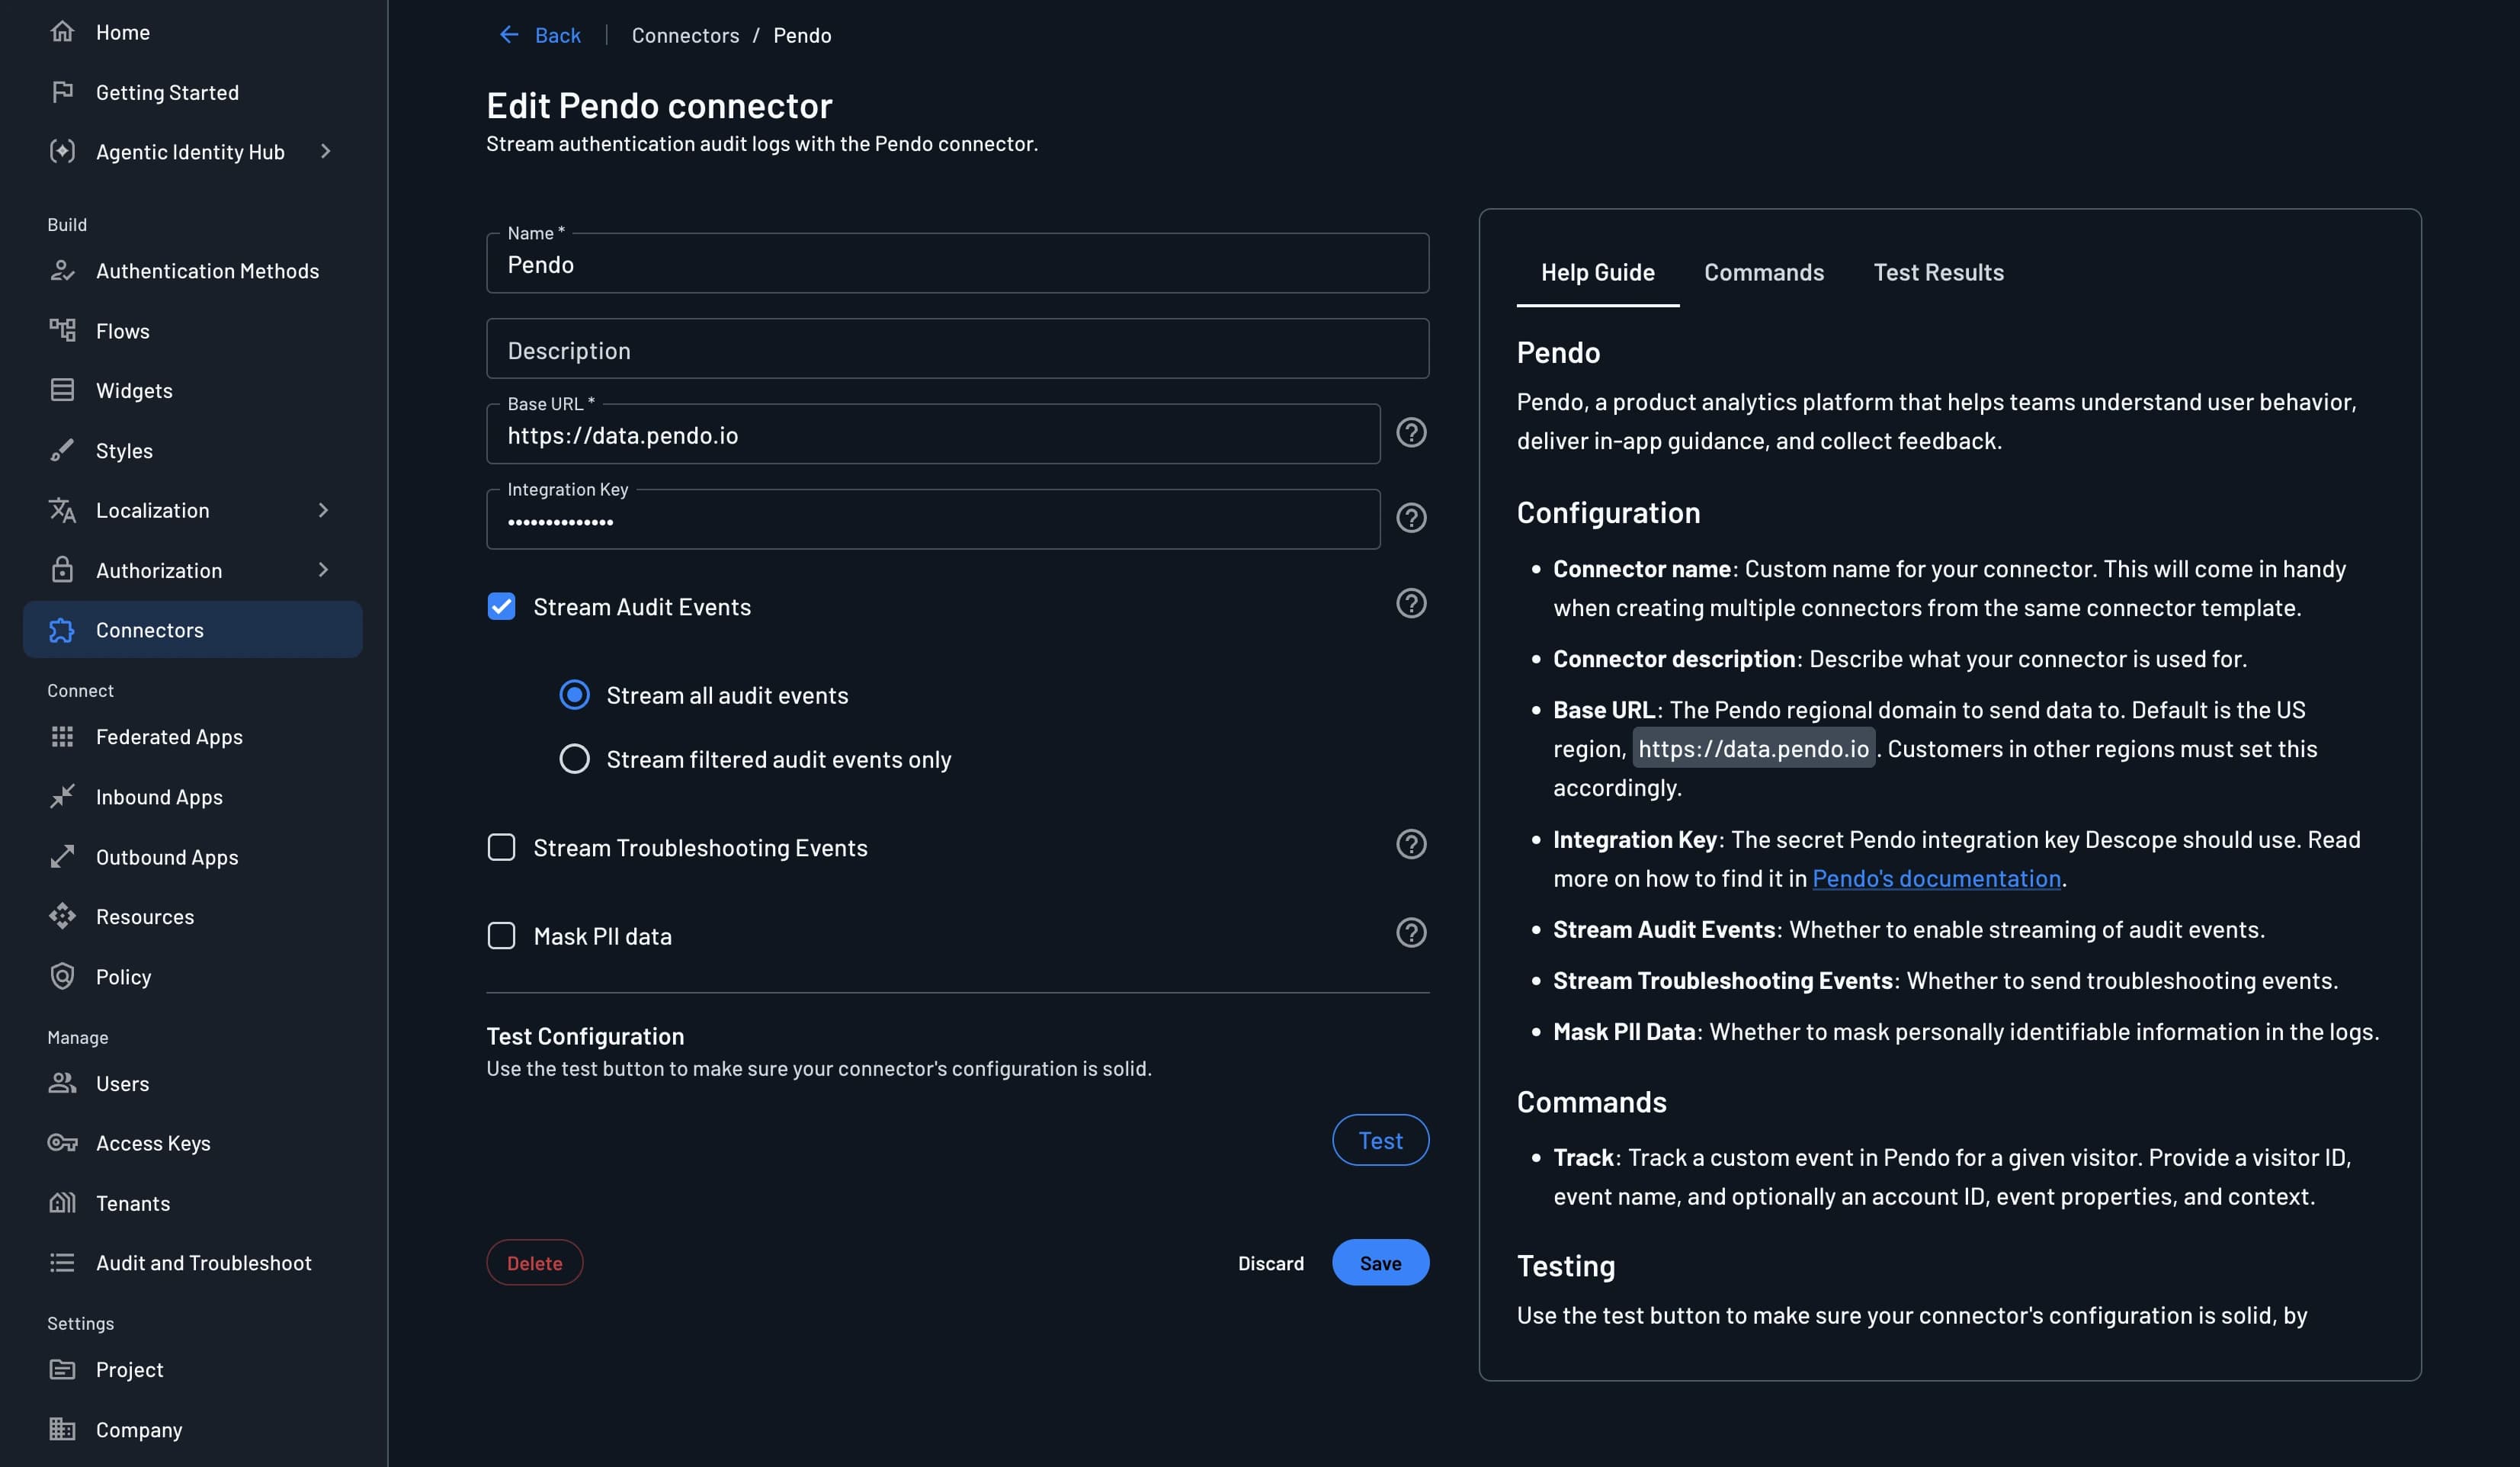
Navigate to the Connectors page in the Descope Console and select Pendo to create a new Pendo connector.
The following parameters are required to use it:
- Connector Name: Provide a unique name for your connector. This assists in distinguishing it, especially when multiple connectors are derived from the same template.
- Connector Description: (Optional) Briefly explain the purpose of this connector.
- Base URL: The Pendo regional domain to send data to. Default is the US region,
https://data.pendo.io. Customers in other regions must set this accordingly. - Integration Key: Your Pendo Integration Key, used to authenticate requests to the Pendo API. You can find it in the Pendo Console under Settings > Integrations > Integration Keys.
- Stream Audit Events: Select which events are sent to Pendo. Descopers can allow all audit events or filter them based on certain actions that occur or tenants in the project.
- Stream Troubleshooting Events: Decide whether troubleshooting events are also sent to Pendo.
- Mask PII data: Decide whether to mask PII (personally identifiable information) in the logs.
Testing
Before creating your connector, it's important to verify that the connector configuration works. For this, simply click on "Test" and view the Test Results panel. Confirm it works and click Create.
Viewing Audit Logs
Once configured, audit logs are automatically streamed to Pendo as track events. The connector can be tested while configuring it to ensure the logs are being sent and collected properly.
The logs can still be viewed in Descope under the Audit and Troubleshoot section of the Descope Console.
In Pendo, navigate to your app's event or track event data to view your Descope audit events.
Each event contains detailed information, including user actions, timestamps, and other relevant data, which you can use with Pendo's reporting and segmentation tools to gain insights into your events.
Tracking Custom Events in Flows
In addition to streaming audit events in the background, the Pendo connector can be added as a step within your flows to track a custom event for a given visitor.
Navigate to Flows, choose your flow. Then, tap the create button (designated via the + icon), select Connector, and choose the Pendo option, then select the Pendo / Track action.
Configure the following fields:
- Step name: The unique name for the step.
- Connector: Name of the connector which was used to set up the connector.
- Event: The name of the custom event to track in Pendo.
- Visitor ID: The ID of the Pendo visitor to associate the event with.
- Account ID (Optional): The ID of the Pendo account associated with the visitor.
- Properties (Optional): A dictionary of custom properties to attach to the event. Use + Add row to add each property.
- Context (Optional): A dictionary of contextual information, such as the user's IP address or URL. Use + Add row to add each entry.
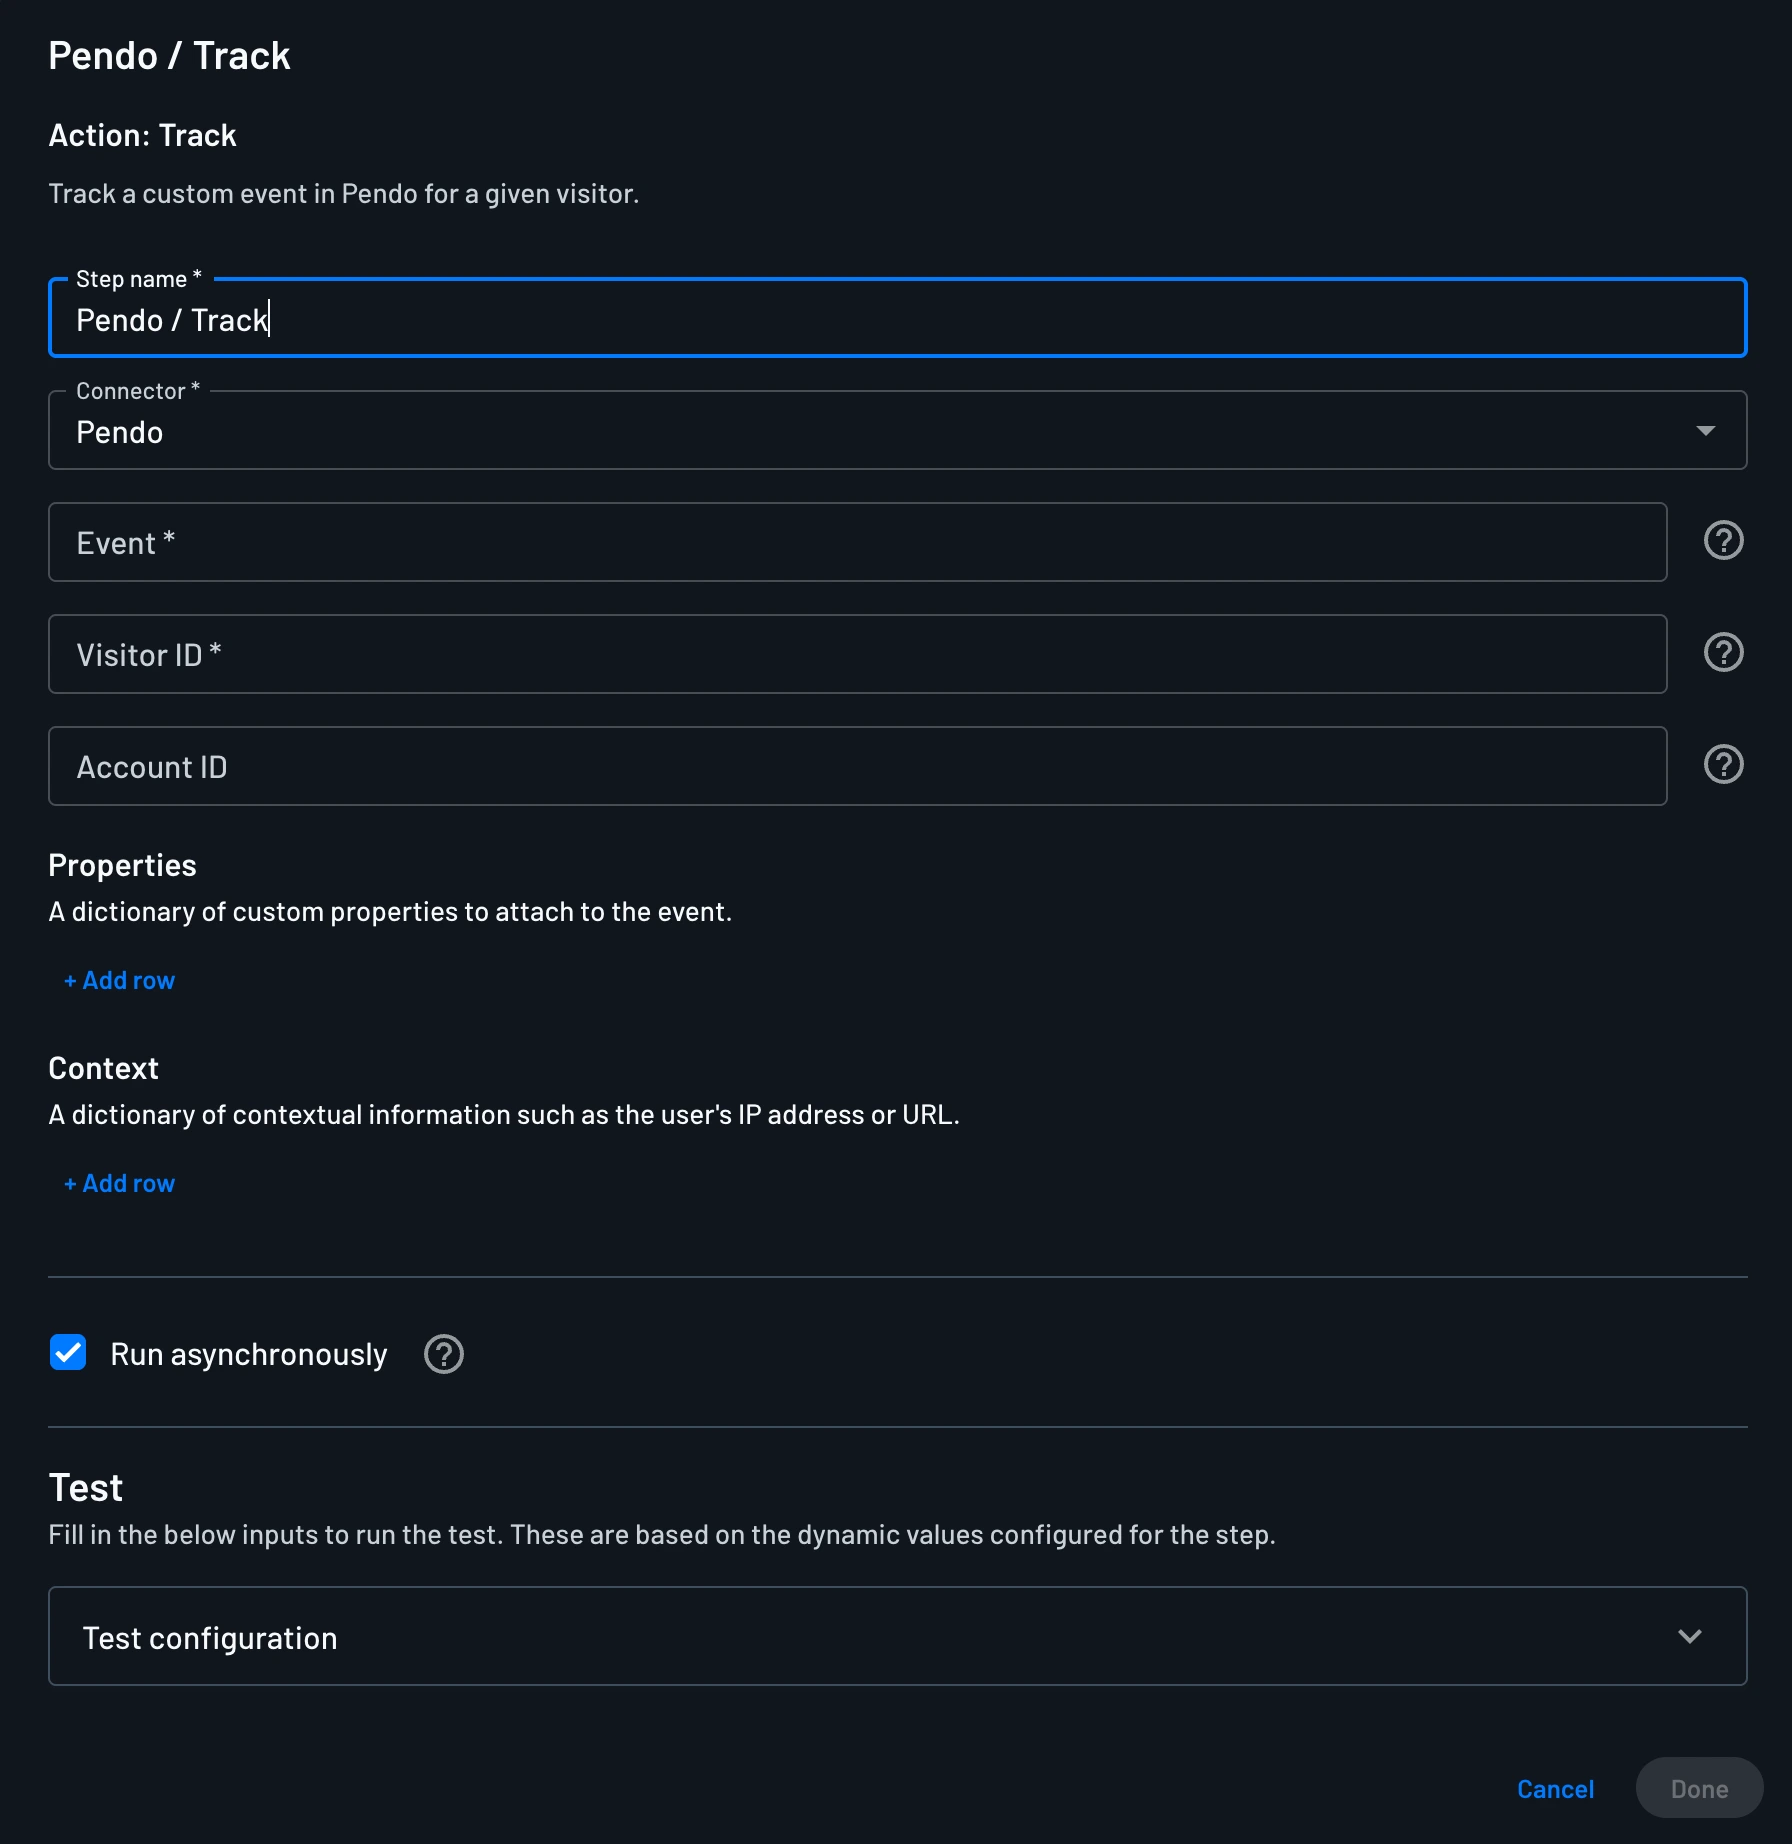
You can also enable Run asynchronously so the flow doesn't wait for a response from Pendo before moving on to the next step.
Once added to your flow, the Track action fires whenever that step is reached, sending the custom event to Pendo for the specified visitor.