Project Dashboards
Descope provides various project dashboards for you to see metrics on your users, tenants, operations, and flows. This data enables you to make informed decisions on how to best leverage Descope.
User Activity Dashboard
The user activity dashboard summarizes the activity of the end users of your Descope project. Here you can track metrics like number of active users over time, authentication methods used, and conversion rates.
You can choose to view metrics over either the past week or the past year, including numbers on daily/monthly active users and new users. You can also see a graph of user activity over the time period selected:

You can also see the following user activity metrics:
-
Flows User Conversion: User conversion is the ratio of completed flows resulting in an authenticated user to incomplete flows.
-
Countries: The distribution of countries from which your users are communicating with your service.
-
Authentication Methods: The distribution of authentication methods with which your users have chosen to authenticate with your service.
-
Devices: The distribution of device types which your users are using when communicating with your service.

Tenant Activity Dashboard
The tenant activity dashboard summarizes the activity of the tenants of your Descope project. You can choose to view metrics over either the past week or the past year, including numbers on daily/monthly active tenants and new tenants. You can also see the following metrics:
-
Active Tenants Over Time: The number of active (2 or more MAUs) tenants over time.
-
Significant Activity Drops: Tenants that have suffered a significant drop in user activity, and the percentage of the drop compared to the previous time frame.
-
Regular vs SSO Tenants: The number of tenants with SSO enabled and without.

Operations & Security Dashboard
The operations & security dashboard provides insights into the security and operational aspects of your Descope project. You can see the following metrics:
-
Top IP Addresses: The IP addresses with the highest number of authentication requests, helping you identify unusual traffic patterns or potential security threats.
-
Top Countries: The countries from which the most authentication requests originate, providing geographic insights into your user base.
-
Referers: The referring sources (URLs or domains) that direct users to your authentication flows, helping you understand how users are accessing your service.
-
Email Domains: The distribution of email domains used by your users during authentication, which can help you identify organizational patterns or potential issues.
-
Country Codes: Here you will be able to see the country codes for phone numbers with which your users are communicating with your service.

Flow Analytics Dashboard
The flow analytics dashboard allows you to select one of your flows and see detailed metrics on it. This data is based on the current version of the flow, and resets when the flow is modified.
- User visit analytics on your current flow version: How many users visited each step of the flow.

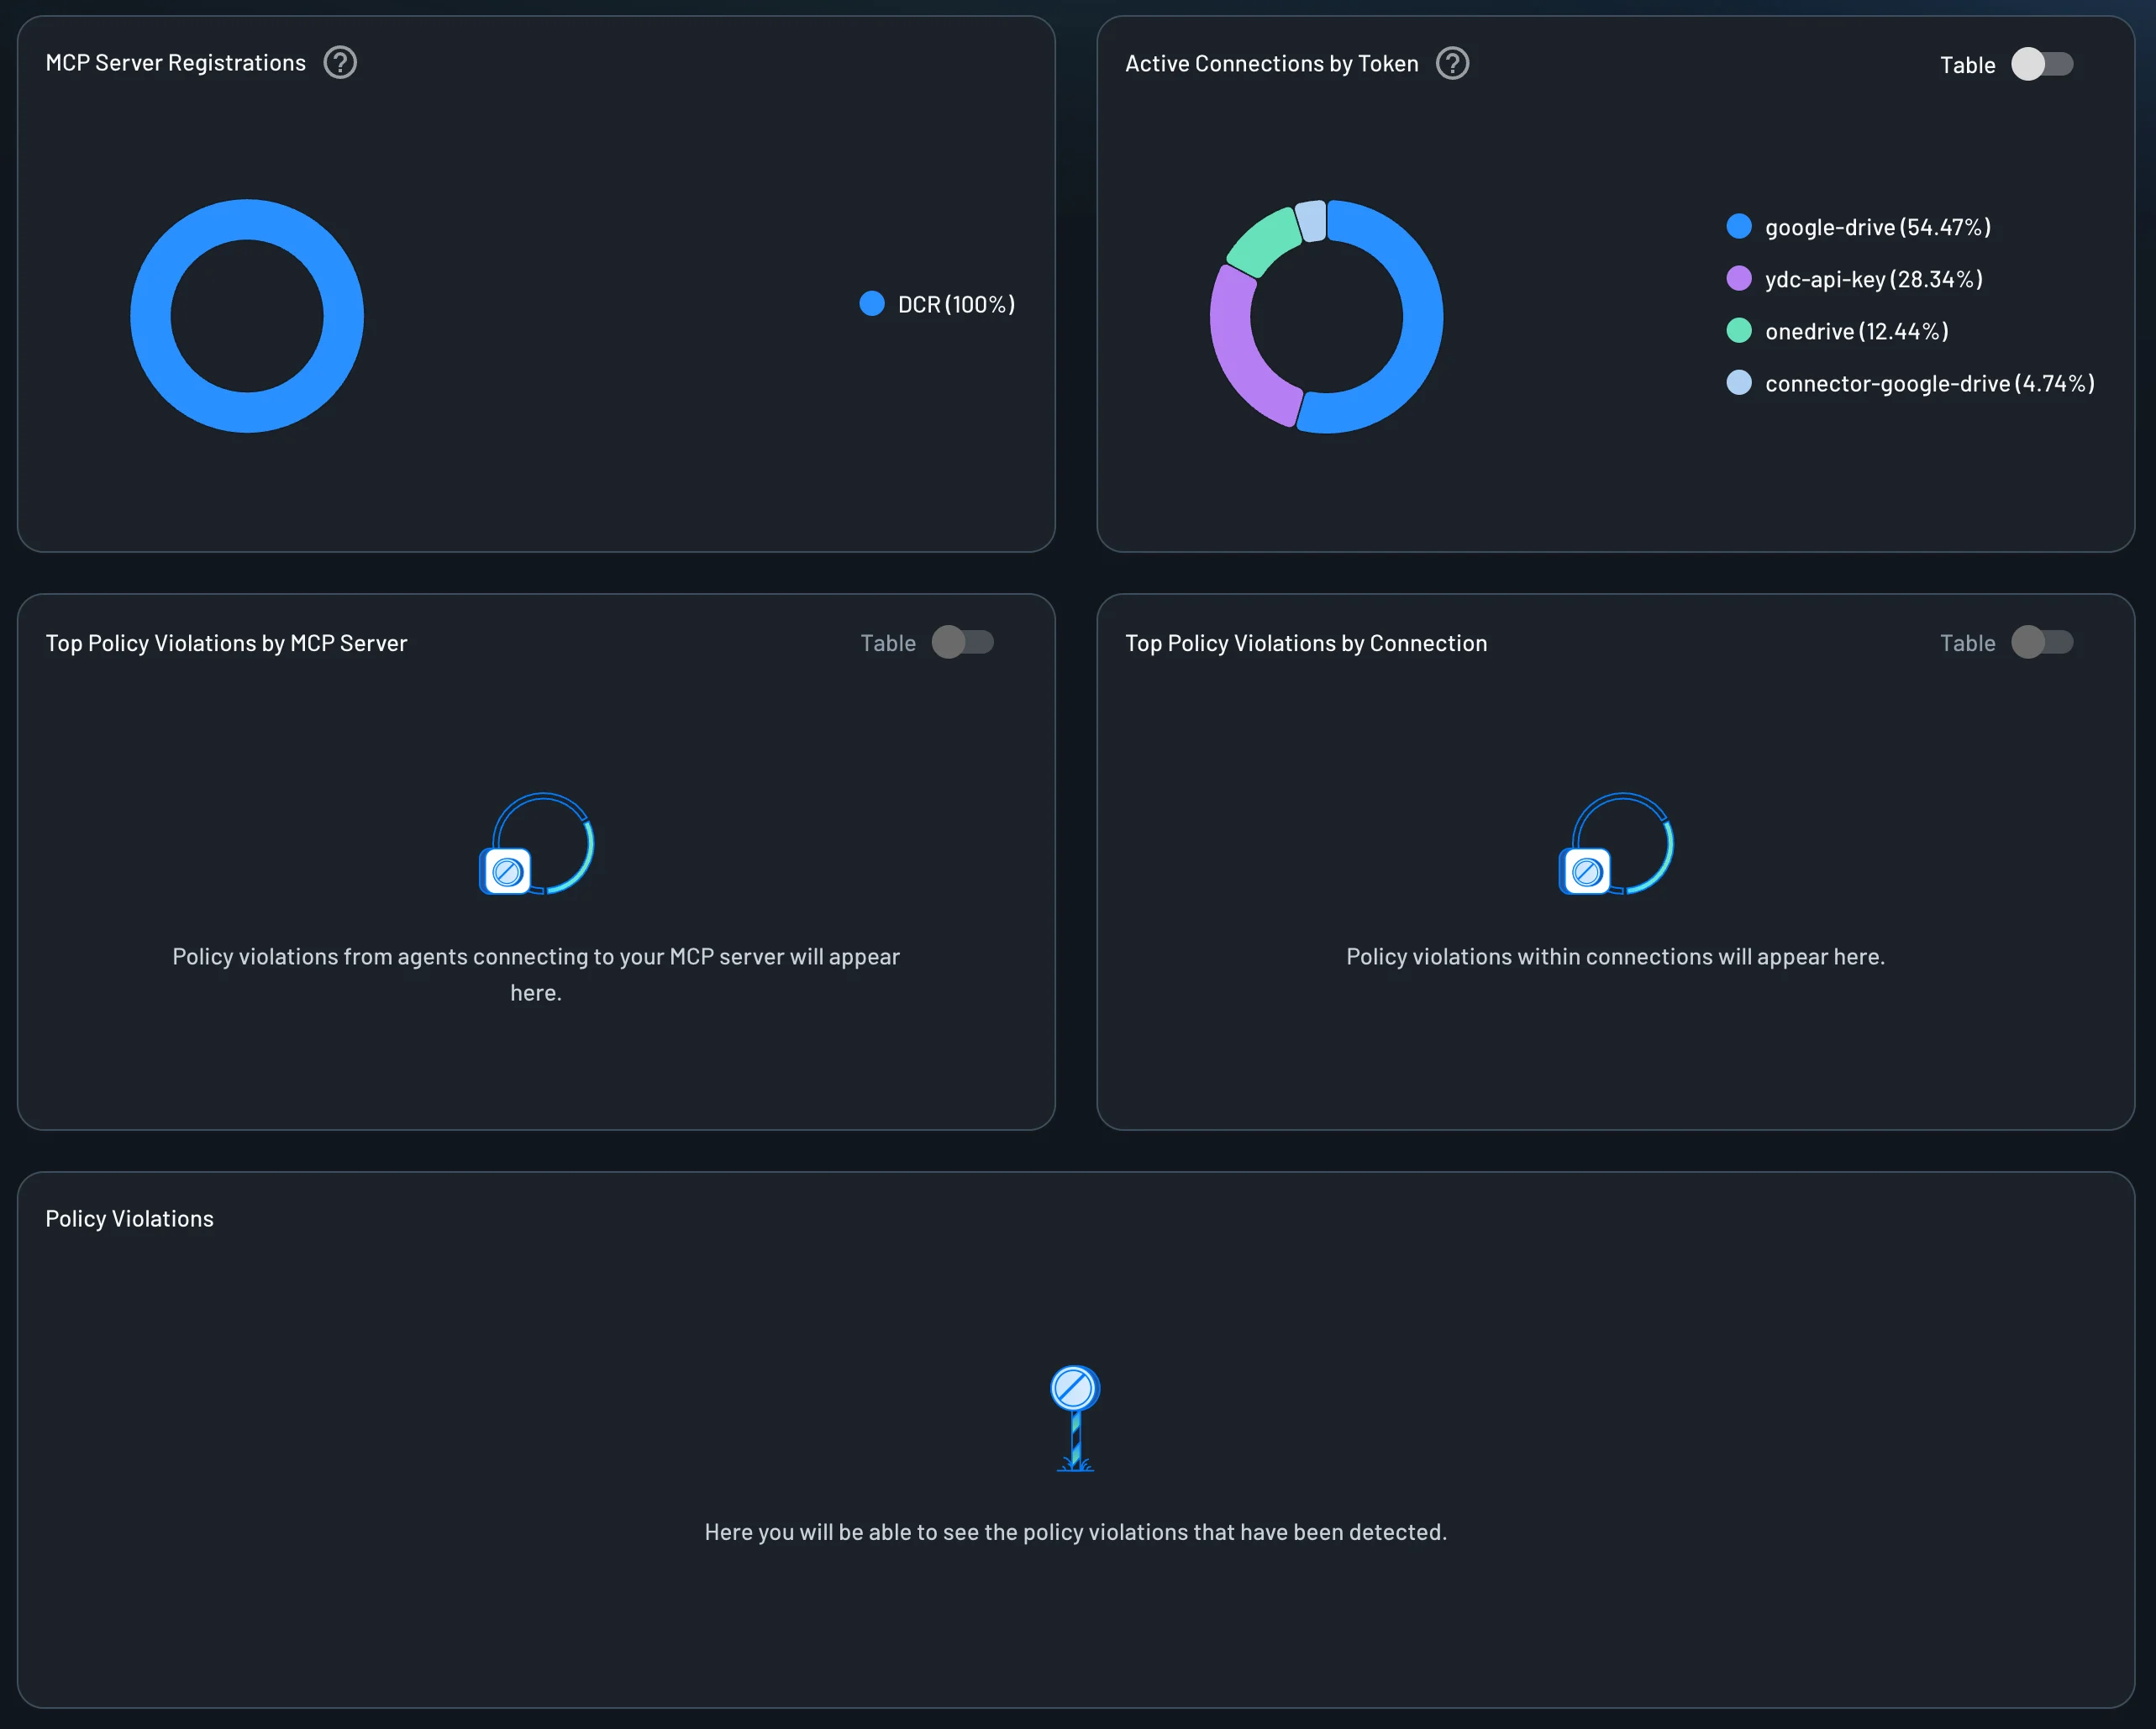
Agentic Activity Dashboard
The agentic activity dashboard allows you to see the activity of the agents of your Descope project. You can see the following metrics:
-
MCP Server Registrations: Shows how agents authenticate when connecting to your MCP servers. Methods include: manual client credentials (pre-configured client ID/secret within an MCP Server), Dynamic Client Registration (DCR), and Client ID Metadata (CIMD) for streamlined OAuth flows.
-
Active Connections by Token: This widget lists the top 5 most commonly used Connections by token count.
-
Top Policy Violations by MCP server: Policy violations from agents connecting to your MCP server will appear here when a client requests Resource scopes that no Policy permits.
-
Top Policy Violations by Connection: Policy violations within Connections will appear here when a client or Resource requests Connection scopes that no policy permits.
-
Policy Violations: All policy violation audit events detected in your project. See Audit Events → Policy violations for the event names and fields logged for each denial.